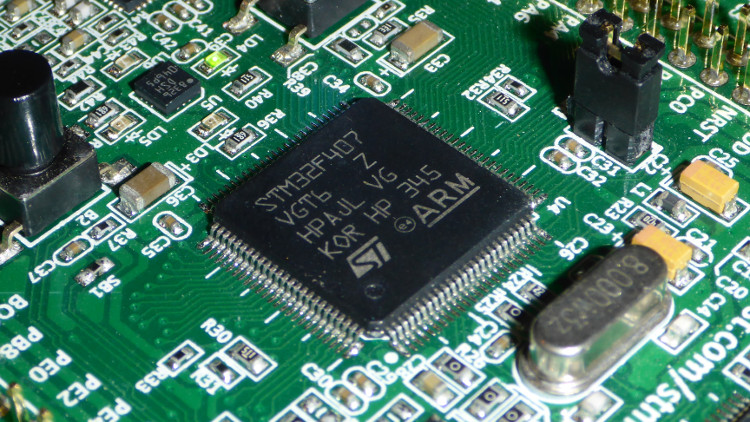
After a long hiatus, I recently picked up my M&M sorter project again. To interface with a certain chip, the code needs to delay a pin read by a couple of nanoseconds, i.e. busy waiting is actually a pretty good choice here.
Nanosecond delays
The Cortex-M4F that I’m using has a cycle count register (CYCCNT), part of the Data Watchpoint and Trace unit (DWT), which makes it very easy do implement reasonably accurate nanosecond delays as follows:
#include <math.h>
#include <stdint.h>

#include <core_cm4.h>
#include <system_stm32f4xx.h>

inline volatile uint32_t getCycleCount () { return DWT->CYCCNT; }

inline void delayCycles (uint32 const numCycles) {
  uint32_t const startCycles = getCycleCount();
  while ((getCycleCount() - startCycles) < numCycles) { }
}

inline uint32_t nanosecondsToCycles (uint32_t const nanoseconds) {
  // At 168 MHz ceil(log2(SystemCoreClock)) is already 28, so don't multiply directly
  // with nanoseconds, because there's a large chance the result will overflow.
  // Alternatively, multiply nanoseconds by 1e3 and divide SystemCoreClock by 1e6.
  uint32_t result = ceil(nanoseconds * ((float) SystemCoreClock / 1e9f));
}
Heisenbug!
So, problem solved, right? Well, not quite… My code consists of multiple FreeRTOS tasks and was behaving rather erratically, e.g. a simple blinking LED would stop soon after power-up. At first I blamed this on wrong task priorities, so I kept increasing my “heartbeat LED” task’s priority until it worked again. Only when the priority was equal to or higher than the task with the nanosecond delay would everything (seem) to work correctly.
The extremely frustrating thing was that as soon as I attached a debugger to the microcontroller everything worked just fine… I messed around with GDB settings, tried the STM32 built-in debugger as well as a SEGGER J-Link, but always got the same result: without debugger the chip locked up, with debugger it worked just fine. Hours of wasted time later, I finally found the reason and fixed the heisenbug!
It turns out that the cycle counter needs to be enabled first. Now, this would be an easy to figure out bug, where it not for the fact that the debugger does this automatically upon connecting to the Cortex-M. My best guess is that the debugger enables the TRCENA bit in the “Debug Exception and Monitor Control Register” (DEMCR), which is needed if it wants to step through code. According to the ARMv7-M Architecture Reference Manual (section C1.6.5, p. 765), the TRCENA bit is a “Global enable for all DWT and ITM features”, i.e. when set the cycle counter automagically comes to life. Heisenbug explained?
Enabling the cycle counter
So, enough with the technical mumbo-jumbo, how to fix this? Well, easy enough, first the DWT needs to be enabled, and next the cycle counter can be enabled. As noted in this StackOverflow question, on a Cortex-M7 one first has to unlock access to the DWT as well.
#include <core_cm4.h>

inline void enableCycleCounter () {
  CoreDebug->DEMCR |= CoreDebug_DEMCR_TRCENA_Msk;

#if __CORTEX_M == 7
  // Unlock DWT.
  DWT->LAR = 0xC5ACCE55;
#endif

  DWT->CYCCNT = 0;
  DWT->CTRL |= DWT_CTRL_CYCCNTENA_Msk;
}
Note that all of the above code assumes the CMSIS headers (e.g. core_cm4.h) are used. Thus, this should work on any Cortex-M, not just the STMicro one that I’m using. Bonus: no magic numbers and no digging through manuals to figure out register addresses and enable bit offsets.
